
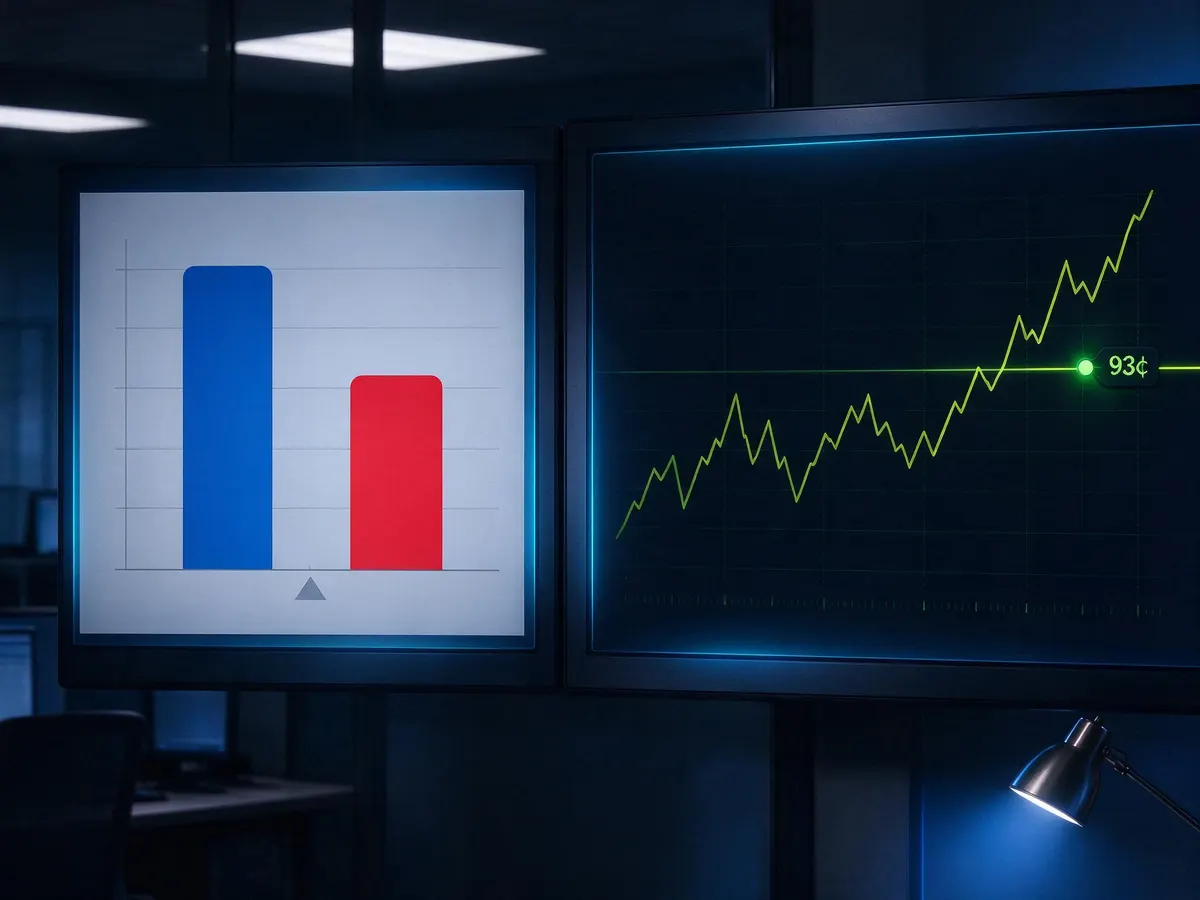
Picture two browser tabs open on an October evening. In the first, a polling average for the generic congressional ballot has Democrats ahead by roughly nine points. In the second, a prediction market has Democratic control of the House trading at 93 cents on the dollar. Same election, same direction, wildly different-looking numbers. So which one is telling you more?
That question is the whole debate over prediction markets vs polls, and the 2026 midterms are the best live test case we’ve had since the exchanges went mainstream. The short version: those two numbers aren’t competing estimates of the same thing. One is a margin. The other is a probability. Understanding the gap between them is more useful than picking a winner.
What “D+9” actually measures
The generic congressional ballot asks a simple question: if the election were held today, would you vote for the Democratic or Republican candidate in your district? Average enough of those surveys and you get a national vote-share estimate. Heading into November 2026, that average sits around nine points in the Democrats’ favour.
Notice what it does not say. It says nothing about seats. It says nothing about probability. It’s a measurement of opinion at a moment in time, with a margin of error attached, and it comes from a methodology that has been refined and stress-tested for the better part of a century.
Turning a national vote margin into a seat count requires a model: district boundaries, incumbency, candidate quality, turnout assumptions, how efficiently each party’s votes are distributed. A nine-point national lead is a large lead by historical standards, but the translation into House seats is where forecasters earn their keep, and where they disagree with each other.
What a 93% price actually measures
A prediction market skips the opinion layer entirely. On an exchange like Kalshi or Polymarket, you buy a contract that pays out a fixed amount, usually $1, if an outcome happens and nothing if it doesn’t. If “Democrats win the House” trades at 93 cents, the market is collectively pricing that outcome at about a 93% chance.
That price already contains the poll. It also contains fundraising reports, retirement announcements, redistricting rulings, special election results, and whatever a few thousand traders think the models are getting wrong. It’s a weighted consensus with money behind it.
Now do the arithmetic from a trader’s point of view, because this is the part people skip. Buying at 93 cents to win $1 risks 93 to make 7, a return of about 7.5% if you’re right, with total loss of the stake in the roughly 7% of scenarios where you’re wrong. Before fees and the bid-ask spread, that’s close to a coin-flip in expected-value terms, and fees push it negative. Heavy favourites on prediction markets are not “safe” bets, they’re low-reward bets that require the price to be genuinely wrong in your favour before there’s any edge at all. The exchange takes its cut either way.
Do prediction markets work? The research is split
Anyone who tells you markets cleanly beat polls is overselling. So is anyone who dismisses them.
The case for markets rests heavily on the Iowa Electronic Markets, the long-running academic exchange. A review of its record found the market beat the matching poll in roughly 74% of head-to-head comparisons across five presidential cycles. That’s a real result, and it’s why economists took the idea seriously in the first place.
The case against comes from political scientists Robert Erikson and Christopher Wlezien, whose 2012 study reviewed decades of election markets and concluded that once scientific polling matured in the 1930s, markets stopped adding predictive value over polls. Their argument isn’t that markets are stupid, it’s that markets mostly read the polls, so comparing them is partly circular.
Then came 2024, which handed both camps ammunition. A 2025 analysis led by economist Rajiv Sethi found that Polymarket’s national forecast for the popular vote and the Electoral College performed about in line with standard statistical models, not meaningfully better. The same research found markets did considerably worse than the models further down the ballot, especially on Congressional races.
The down-ballot problem, which is exactly the midterm problem
That last finding should make you cautious about 2026, because a midterm is a down-ballot election by definition. There is no presidential race at the top of the ticket pulling in attention and money.
Markets get sharp when lots of informed people trade them. A House control market attracts enormous volume, so its price is reasonably well-sharpened. A market on a single competitive district in, say, Pennsylvania or Arizona might see a fraction of that. Thin markets mean wide spreads, a handful of traders setting the price, and more room for one confident person with a strong opinion to move the number several points without any new information behind it.
So treat the headline market, House control or Senate control, as a credible consensus. Treat individual race markets with the same scepticism you’d apply to a single poll of 400 likely voters.
Where markets genuinely beat polls: speed
Here’s the advantage nobody disputes. Throughout 2024, market prices moved within hours of real-world events. Polling averages took days to reflect the same news, because fielding a survey, weighting it, and publishing it is a slow process by design.
That matters most in the final two weeks of a campaign and on election night itself, when information arrives faster than any pollster can field a questionnaire. A scandal breaks at 9am and the market has repriced by lunch. The polling average hasn’t heard about it yet.
Speed and accuracy aren’t the same thing, though. A market that reprices instantly also overreacts instantly. Fast is not the same as right.
The two signals side by side
| Generic ballot polling average | Election prediction markets | |
|---|---|---|
| What it outputs | A vote margin (e.g. D+9) | A probability (e.g. 93%) |
| Where the number comes from | Weighted survey samples | Traders risking money on contracts |
| Update speed | Days | Minutes to hours |
| Main weakness | Sampling and turnout-model error; slow | Thin liquidity on small races; overreaction to news |
| 2024 national performance | Models built on polls performed respectably | Roughly in line with those models |
| 2024 down-ballot performance | Models outperformed markets | Noticeably weaker on Congressional races |
Not all exchanges resolve equally well
One more detail that gets lost in the big-picture debate: the platform matters. Across 2024 election markets, one exchange resolved about 93% of its contracts in line with the eventual outcome. Another landed closer to 67%. Same election, same public information, very different hit rates, driven largely by which contracts each platform chose to list and how much volume those contracts attracted.
Structure differs too. Kalshi election contracts trade on a federally regulated US exchange under CFTC oversight, with dollar-denominated contracts and conventional account verification. Polymarket operates as a crypto-settled market with a different user base and different rules about who can access it. Availability depends on where you live, and in some jurisdictions these products aren’t legally available at all. Check before you deposit anything.
How I’d read the two through November
Use the polling average for magnitude and the market for probability, and get suspicious when they disagree.
If the generic ballot narrows to D+4 while the House market stays pinned at 93%, one of two things is happening: either traders believe something the polls haven’t picked up yet, or the market has gone stale and complacent on a favourite. That divergence is the most informative signal either source produces, far more useful than either number read alone.
And keep the limits in view. A 93% price is not a forecast of a 93-point win, and it isn’t a prediction that anything will happen. It means roughly one in fourteen versions of this election goes the other way, which is not a rounding error. Markets priced 2016 and several 2024 Senate races confidently and got embarrassed.
If you do trade these contracts, treat it the way you’d treat any wager with a built-in house margin: with money you can afford to lose, with limits set in advance, and without mistaking a confident-looking number for a certainty. The exchange’s cut doesn’t care who wins the House. Most jurisdictions where these markets are legal also offer deposit limits and self-exclusion tools, and they’re worth using before conviction turns into overexposure.
The honest conclusion from the research is unglamorous. Markets are faster, polls are better understood, and on big national questions they end up in roughly the same place. On a single House district in a low-turnout midterm, trust neither one too far.